What, Why, How to do continuous monitoring?
First published on Medium
Introduction
In many discussions, automated deployments or CI/CD pipelines may be the most popular in all those common DevOps duties. Some even say it is the only important thing or value DevOps provides. However, DevOps is much more than just doing deployment or automating stuff. Coding and deployment are undeniably important in a software development lifecycle, but post-deployment is also part of the keys to a successful solution: monitoring.
Monitoring, or continuous monitoring, refers to constant observation and tracking of your application’s health, performance, and security in real time. Compared to traditional monitoring, it tries to detect problems in advance instead of reactive actions when issues occur.
In modern software development, especially with practices like DevOps and Agile, your applications are updated frequently, possibly multiple times a day. Without continuous monitoring, you will get tons of user reports and complaints if you use a reactive approach in a fast-paced lifecycle.
Key Metrics to Monitor
Many metrics are available to monitor, but not all are useful for your application. Using the right metrics is essential in good monitoring solutions. The choice of metrics depends on the nature of the application, its architecture, and the infrastructure. For example, it could be a big difference if it is a cloud, on-premises, or hybrid environment.
Performance Metrics
This is a metric that indicates how well your application is responding to user requests. The metric should give insight into loading speed, availability, and scalability.
There are some common metrics to measure performance.
- Response time. It is the latency of how long your application takes to respond to a request. A high response time can represent an inefficient system that could overload your servers.
- Throughput. It indicates the number of requests your application can handle within a given time, such as per second. It can bring up a big issue if a low throughput has been found from a high-load service.
- Request rate. It tracks the number of requests that hit your application servers. This metric is usually used as a reference for user activity, which gives insight into designing a highly available and scalable infrastructure.
- Error rate. It counts the failed requests that directly indicate application errors caused by bugs, configuration issues, or integration failures with third-party services.
Resource Utilization Metrics
This is a metric of how your application consumes system resources, such as CPU, memory, disk, and network bandwidth. They are necessary for resource allocation design, performance optimization, and scalability.
These are the common metrics to know available resources.
- CPU utilization. It is how much of the application servers’ CPU resources are being used. Continuous high utilization could cause performance degradation or even service downtime.
- Memory usage. It is the amount of memory the application is consuming. Without efficient memory, it can lead to crashes, slow performance, or even some out-of-memory (OOM) errors.
- Disk I/O. It measures the read/write operations towards the disk. If you indicate a high disk I/O, it is a flag that data processing may have improper indexing, which possibly causes bottlenecks in database operations and file access.
- Network traffic. This counts the amount of data sent from the servers or received over the network. In some cases, the network is a bottleneck that is easy to ignore. It can help to detect throttling issues or unexpected traffic surges.
- Database query performance. It identifies inefficient database operations by query execution time, slow queries, and connection pool usage.
Availability and Uptime
Availability is always the biggest reason for setting up all kinds of monitoring. It ensures your application is accessible no matter when the users need it.
We usually use the following metrics.
- Uptime. It is the total time that your application is available without interruptions. For example, internal applications should be up and running during working hours. If you are providing a SaaS product, you may need a high uptime, like 99.99%, to ensure it follows the SLA and SLO.
- Dependency health check. It is necessary to monitor third-party services or APIs if they play an important role in your application. A proper dependency health check informs you of any downtime from external services so that you can notify your users in advance or even prepare alternative solutions in the short term.
Security Metrics
Security monitoring is vital to protect your applications and their infrastructures. These metrics warn about potential threats and suspicious activities as soon as possible.
- Intrusion detection. Unauthorized attempts to access systems are one of the most common events. To identify brute-force or hacking attempts, you can monitor login attempts, password failures, and suspicious IP activities.
- Vulnerability scanning. The packages, libraries, and patches used by your application always have vulnerabilities in different severities. Regular scanning provides up-to-date data on many known issues so that you can decide the priority to apply patches using the provided severity.
- SSL/TLS certificate expiry. You should always monitor the expiry date of SSL/TLS certificates and replace them in advance to ensure they are always working.
- Audit logs. It keeps a history of all actions, including both authorized and unauthorized, within your applications or infrastructure. It allows you to trace the source of the attack when security breaches have happened.
- Data integrity. It monitors any unauthorized changes to system files, application configurations, and databases.
Tools
Choosing the right tools for your continuous monitoring solution is important to get insights into your applications, like their health, performance, and security. There are various options on the market depending on your needs. They include both open-source and paid services.
Prometheus
An open-source monitoring and alerting tool primarily designed for reliability and scalability in cloud-native environments. It has three main key features, which are metrics collection, powerful query language (PromQL), and alerting.
For a simple example, Prometheus uses HTTP endpoints to pull metrics from your Kubernetes cluster. Then, you can use the PromQL to perform queries against those collection metrics. Finally, the built-in Alertmanager handles the alert routing, silencing, and escalation.
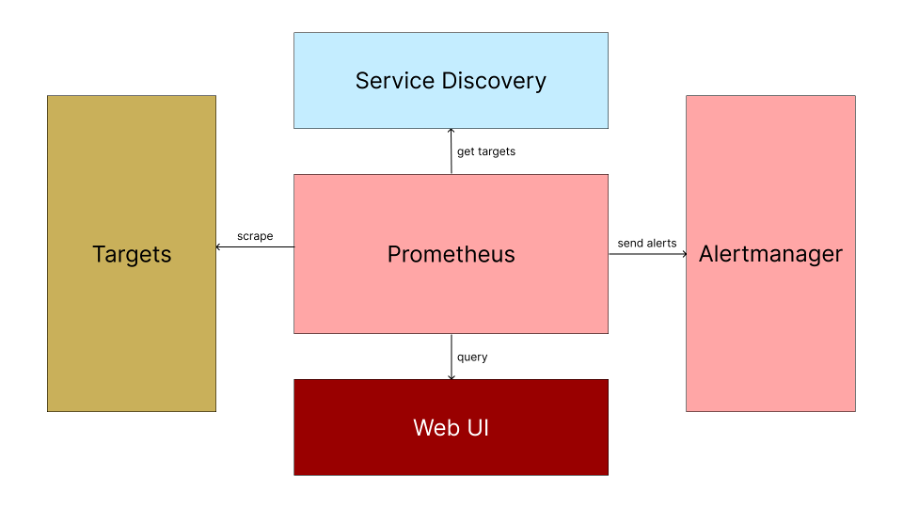
Prometheus | Simple architecture diagram.
Grafana
A flexible open-source tool mainly used for visualizing time-series data. It is commonly used with Prometheus to create customized dashboards for displaying application and infrastructure metrics.
Its key features are custom dashboards, multi-source data integration, and alerting and annotations. Many solutions use Grafana as a centralized monitoring platform by setting up several customized dashboards to monitor different environments. They also provide a cloud version as a SaaS solution.
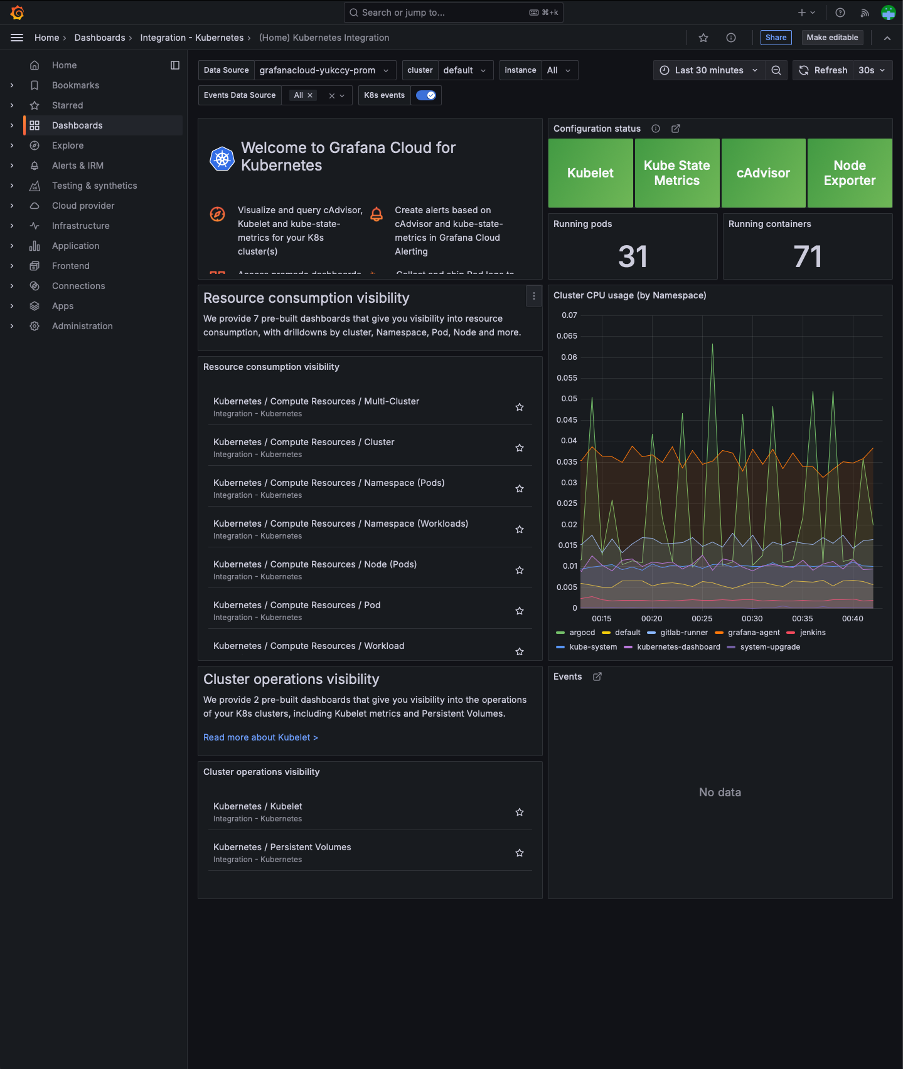
Grafana | Grafana Cloud layout.
Datadog
A SaaS-based monitoring platform that provides full-stack observability, including infrastructure, application performance, logs, and UX monitoring. It is more like an enterprise-level solution that is widely used in cloud and hybrid environments.
The infrastructure monitoring tracks the health of servers, containers, databases, or other computing resources on your cloud infrastructure. At the application level, it provides end-to-end request tracing for performance diagnosis. It also centralizes logs from services, which allows easy queries for further investigation.
AWS CloudWatch
An AWS native monitoring service for AWS resources, which provides observability for infrastructure and applications on the AWS cloud.
As an all-in-one solution, it tracks metrics for AWS computing services like EC2, Lambda, Beanstalk, ECS, and more. It collects the logs and aggregates them into log groups for future analysis. To catch specific events and send alerts, it comes with an alarm and notification system if you integrate with their SNS service.
It is undeniably the best monitoring solution if you are mainly built on the AWS cloud.
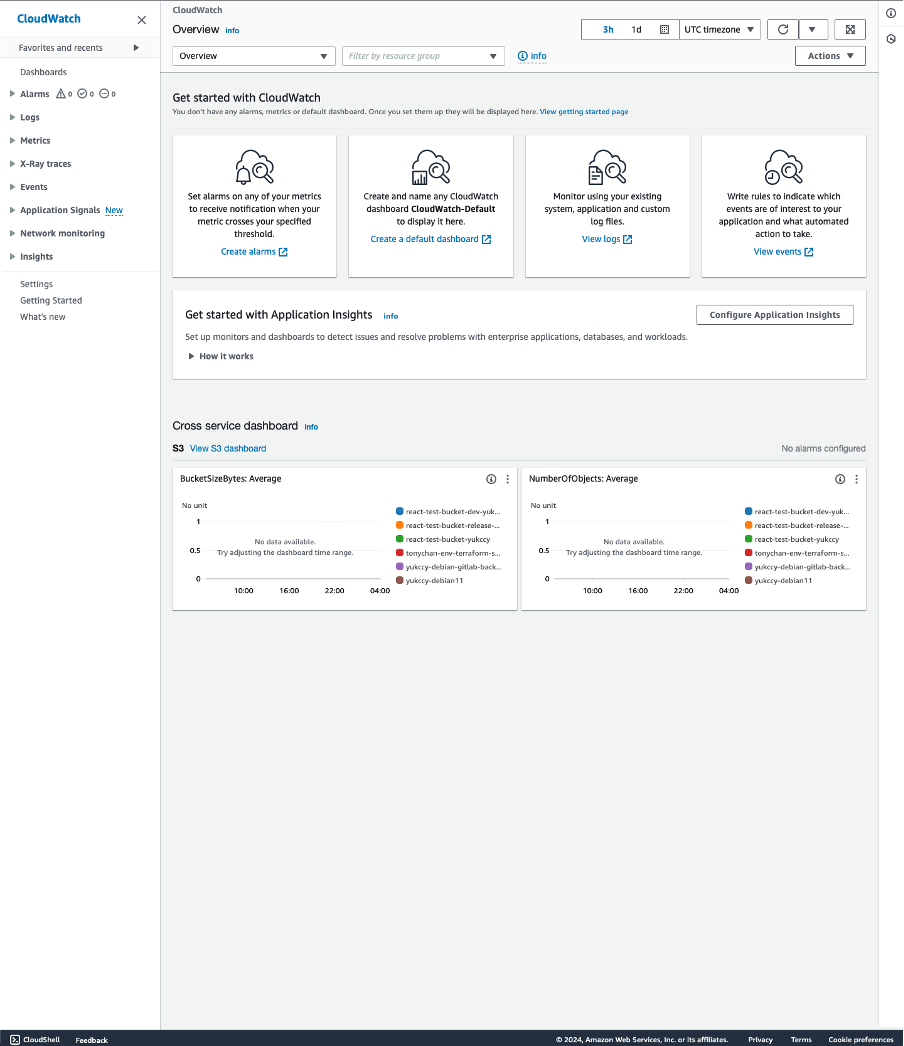
AWS CloudWatch | CloudWatch on AWS Console.
Implement Continuous Monitoring
Continuous monitoring sometimes sounds complicated. It could be, but you can also start with a super simple solution. In this section, we will use the AWS CloudWatch to set up heartbeat monitoring on a single URL.
- Go to the CloudWatch page on the AWS Console and choose Synthetics Canaries under Application Signals.
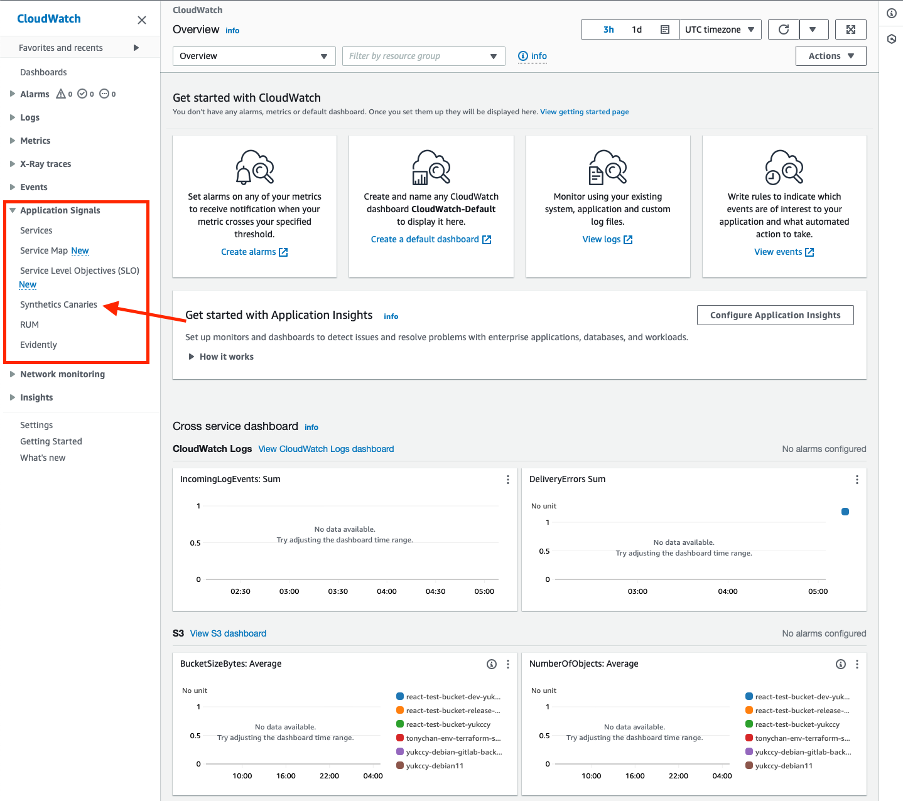
Implement Continuous Monitoring | CloudWatch page on the AWS Console.
2. Click the Create Canary button.
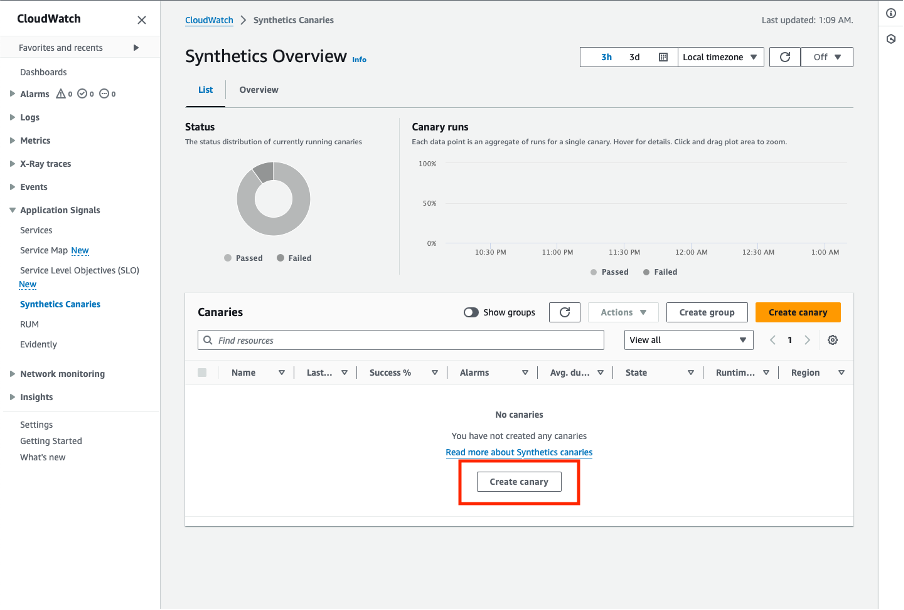
Implement Continuous Monitoring | Create Canary under Synthetics Canaries.
3. Choose Heartbeat Monitoring from the blueprints, then fill up the necessary fields.
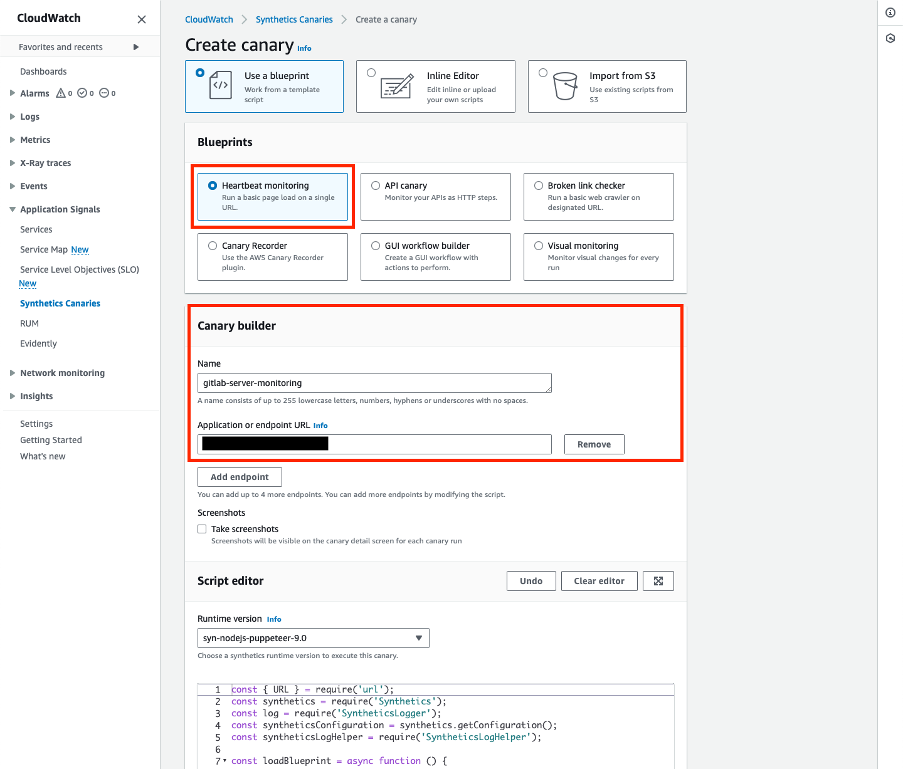
Implement Continuous Monitoring | Create a heartbeat monitoring.
4. Set the schedule that how often will the monitoring run.
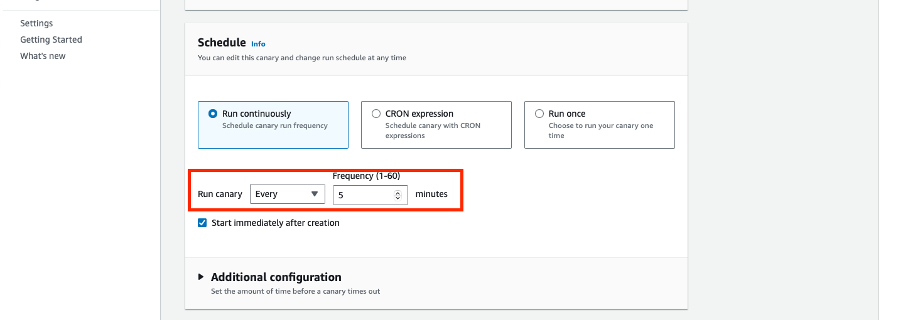
Implement Continuous Monitoring | Set the schedule of the canary.
5. Leave other fields as default and create the canary.
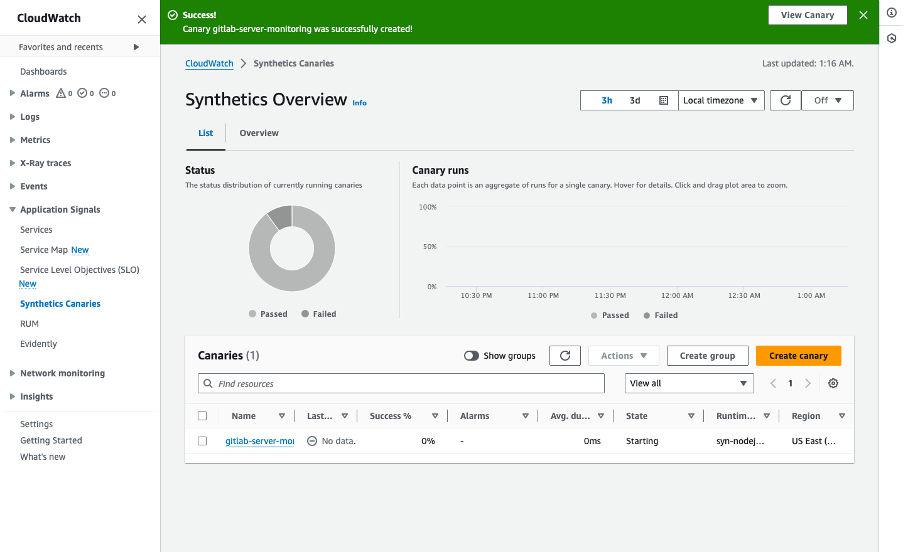
Implement Continuous Monitoring | Created a heartbeat monitoring.
6. Check the result.
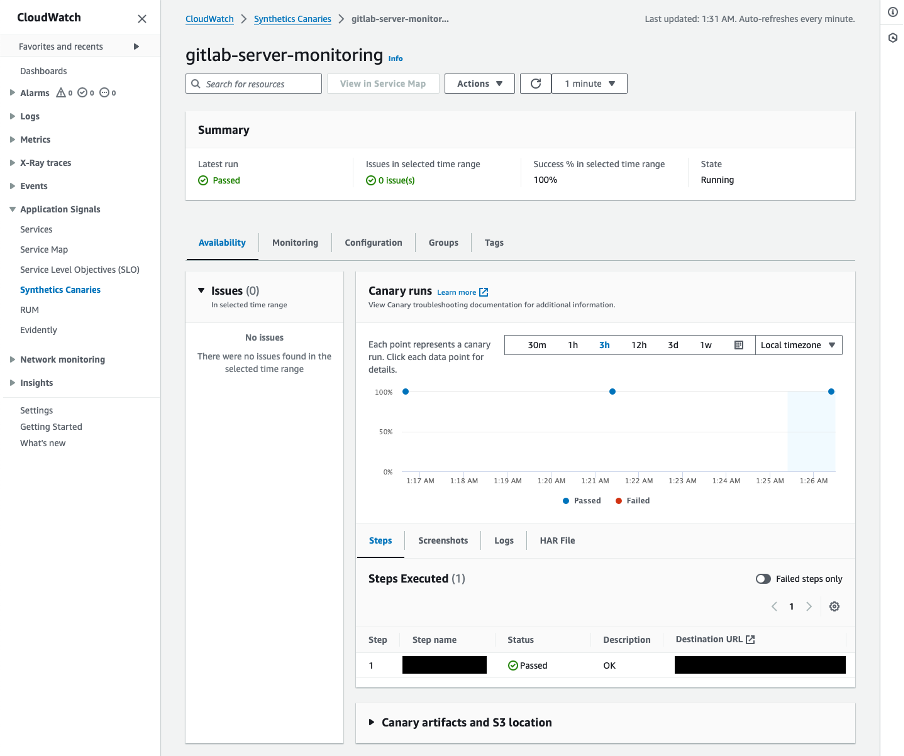
Implement Continuous Monitoring | Result.
Future Trends
Technology is advancing daily, while continuous monitoring is also undergoing significant advancements because of the higher standards.
From my observations, I would predict that continuous monitoring will go this way.
1. AI and Machine Learning.
The algorithms can learn normal behavior patterns from the application and infrastructure and then automatically detect deviations that could lead to any issues. It can also help with incident analysis based on its large and trained data.
2. Automation and self-healing system.
Automation has already played a major role in the software development lifecycle. I believe monitoring will eventually turn to semi or fully automated. The ultimate goal of automated monitoring would be a complete self-healing infrastructure. It will handle all failures, exceptions, and resource allocation by itself.
3. Monitoring as a Service
Since monitoring is getting complicated, outsourcing to a third-party provider can be a trend. The company doesn’t need to manage complex monitoring solutions; experts will handle everything.